7.9 KiB
Hacking
This page discusses some advanced features of the game and targets a more technical audience.
I've always loved it when developers keep debugging features in their released games, and playing around with those and figuring out what makes the game tick. I purposely left some debug features in the game that you can play around with.
Debug Features
Pressing F3 within the game will draw the Debug Overlay on top of the
screen, displaying details such as the game's frames per second and some
contextual details like: what is the world index of the pixel below your mouse
cursor, while you're editing a level? (Details such as this are also seen in
the status bar at the bottom of the editor screen).
The game can be launched with certain Environment Variables set to add some additional debug visuals to the game. Examples:
# Draw a semi-transparent yellow background over all level chunks
$ DEBUG_CHUNK_COLOR=FFFF0066 ./doodle

# Set a window size for the application
# (equivalent to: doodle --window 1024x768)
$ DOODLE_W=1024 DOODLE_H=768 ./doodle

# Turn on lots of fun debug features.
$ DEBUG_CANVAS_LABEL=1 DEBUG_CHUNK_COLOR=FFFF00AA \
  DEBUG_CANVAS_BORDER=FF0 ./doodle
Supported variables include:
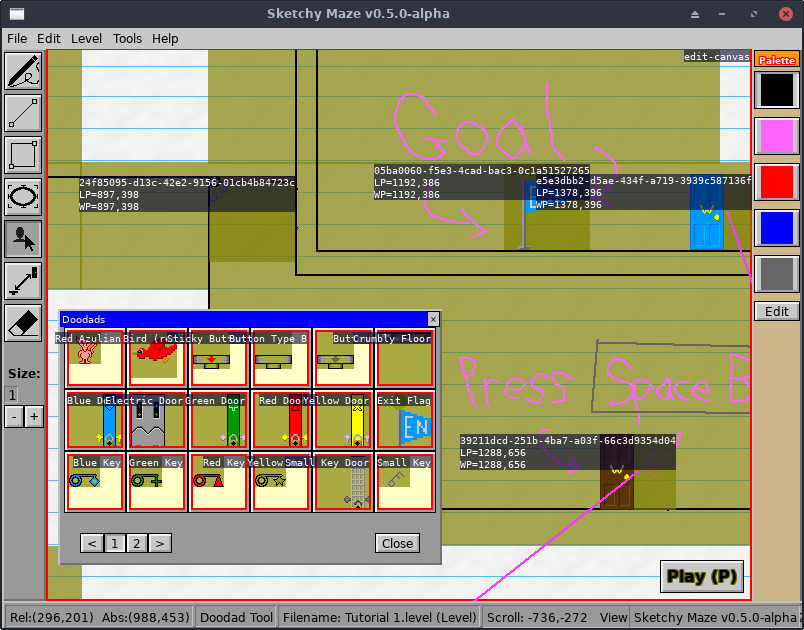
DOODLE_WandDOODLE_Hset the width and height of the application window. Equivalent to the--windowcommand-line option.D_SCROLL_SPEED(int): tune the canvas scrolling speed. Default might be around 8 or so.D_DOODAD_SIZE(int): default size for newly created doodadsD_SHELL_BG(color): set the background color of the developer consoleD_SHELL_FG(color): text color for the developer consoleD_SHELL_PC(color): color for the shell prompt textD_SHELL_LN(int): set the number of lines of output history the console will show. This dictates how 'tall' it rises from the bottom of the screen. Large values will cover the entire screen with console whenever the shell is open.D_SHELL_FS(int): set the font size for the developer shell. Default is about 16. This also affects the size of "flashed" text that appears at the bottom of the screen.DEBUG_CHUNK_COLOR(color): set a background color over each chunk of drawing (level or doodad). A solid color will completely block out the wallpaper; semitransparent is best.DEBUG_CANVAS_BORDER(color): the game will draw an insert colored border around every "Canvas" widget (drawing) on the screen. The level itself is a Canvas and every individual Doodad or actor in the level is its own Canvas.DEBUG_CANVAS_LABEL(bool): draws a text label over every Canvas widget on the screen, showing its name or Actor ID and some properties, such as Level Position (LP) and World Position (WP) of actors within a level. LP is their placement in the level file and WP is their actual position now (in case it moves).
Developer Console
Pressing the tilde/grave key (`) at any time will open the developer
console at the bottom of the screen (all gameplay logic is paused while the
console is open).
In the console you can type anything from simple commands, to hidden cheat codes, to JavaScript commands to operate on some of the game's internal code!
Pressing Enter without typing a command will close the console.
Commands
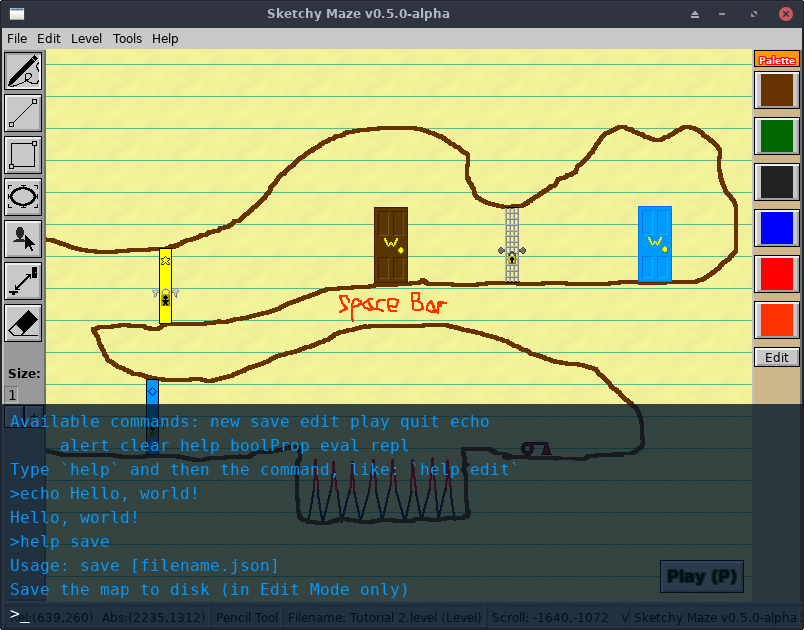
At the white > prompt you can type a command. Typing help will show
a listing of available commands; typing help and then a command name will
show further usage of that command. For example, help echo.
The answer to your command is "flashed" in blue text at the bottom of the
screen and the developer console is closed. Pressing Enter will re-open the
console and show the recent history, including the answer to your last command.
>help echo
Usage: echo <message>
Flash a message back to the console
The following commands are supported:
-
help,help <command>Shows the list of commands, or further help on a specific command.
-
echo <message>Flashes your custom message on the bottom of the screen.
-
alert <message>Pop up an alert box modal with a custom message.
-
newGo to the "New Drawing" screen.
-
save [filename]Save the current drawing. If the drawing has not been saved before, a filename is required, including the
.levelor.doodadsuffix. -
edit <filename>Open a file for editing. The filename is a path on disk relative to the game's working directory.
-
play <filename>Open a file for playing. The filename is a path on disk relative to the game's working directory. A wrong filename will play a new, blank level where Boy just falls to the bottom of the map.
-
closeClose the current level being edited and return to the title screen.
-
quit,exitClose the developer console (an empty command would also work).
Cheat Codes
Typing these messages in the console will toggle various mundane cheat
codes within the game. Press the tilde/grave key (`) to
open the developer console and type:
-
unleash the beastDo not cap the frames per second target of 60, allowing the game to run as fast as it's capable of. May or may not actually work.
-
don't edit and driveWhile playing a level, this makes the level canvas editable and you can draw new pixels by clicking. Note that drawn pixels do not "commit" to the level until you release the cursor.
-
scroll scroll scroll your boatWhile playing a level, this allows scrolling the level with arrow keys as if you're editing it. The camera still keeps the player character in view.
-
import antigravityWhile playing a level, this turns off gravity for the player character. In this state the arrow keys can freely move the character in any direction. Relevant xkcd
-
ghost modeDisable collision detection for the player character. This will also enable antigravity, otherwise you would fall to the bottom of the level.
-
give all keysGives all four colored keys to the player.
-
drop all itemsRemoves all keys and items from the player's inventory.
JavaScript Shell
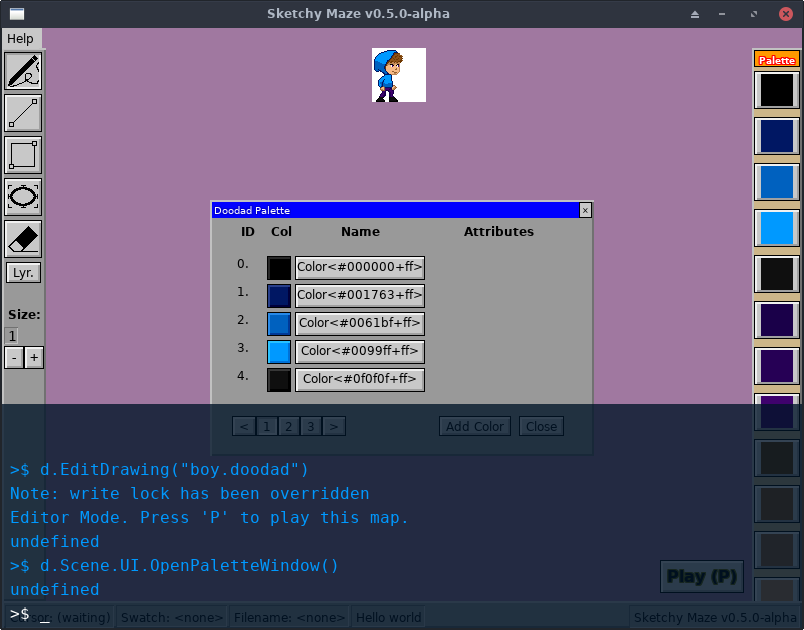
The developer console also features a JavaScript shell, which exposes many of the game's internal data types and functions that can be useful when debugging the game, or just fun to see what you can break within the game!
In the developer console, the eval or $ command will run a single
line of JavaScript code.
>$ 2 + 2
4
>$ d.Flash("This is %s", d.Title())
This is Project: Doodle v0.4.0-alpha
The following native objects are exposed to the JavaScript shell:
dis the master game object.function RGBA(red, green, blue, alpha uint8)creates a native Color type, each value is range 0 to 255function Point(x, y int)creates a native Point type.function Rect(x, y, w, h int)creates a native Rect type.function Tree(ui.Widget)prints a tree of UI widgets drawn on the screen -- if you can find the widgets somewhere underd
>$ RGBA(255, 153, 0, 230).String()
Color<#ff9900+e6>
>$ Object.keys(d)
Debug,Engine,Scene,ConfirmExit,DrawCollisionBox,DrawDebugOverlay,...
>$ typeof(d.Debug)
boolean
>$ typeof(d.Flash)
function
>$ d.Flash("Flash a custom message, like the `echo` command")
undefined
>$ d.EditDrawing("filename.level")
It helps if you run Sketchy Maze itself from a command line terminal,
so you can see its developer console output also on your terminal
window. Using Object.keys(d) will show all the exported functions and
variables from the internal game state.
Understanding that my game's rendering engine and user interface toolkit are open source projects you can have fun reconfiguring widgets to change colors or whatever.


